| dc.contributor.author | Parliamentary Research Team | |
| dc.date.accessioned | 2023-07-31T19:20:13Z | |
| dc.date.available | 2023-07-31T19:20:13Z | |
| dc.date.issued | 2023-03-10 | |
| dc.identifier.uri | https://archive.veriteresearch.org/handle/456/5849 | |
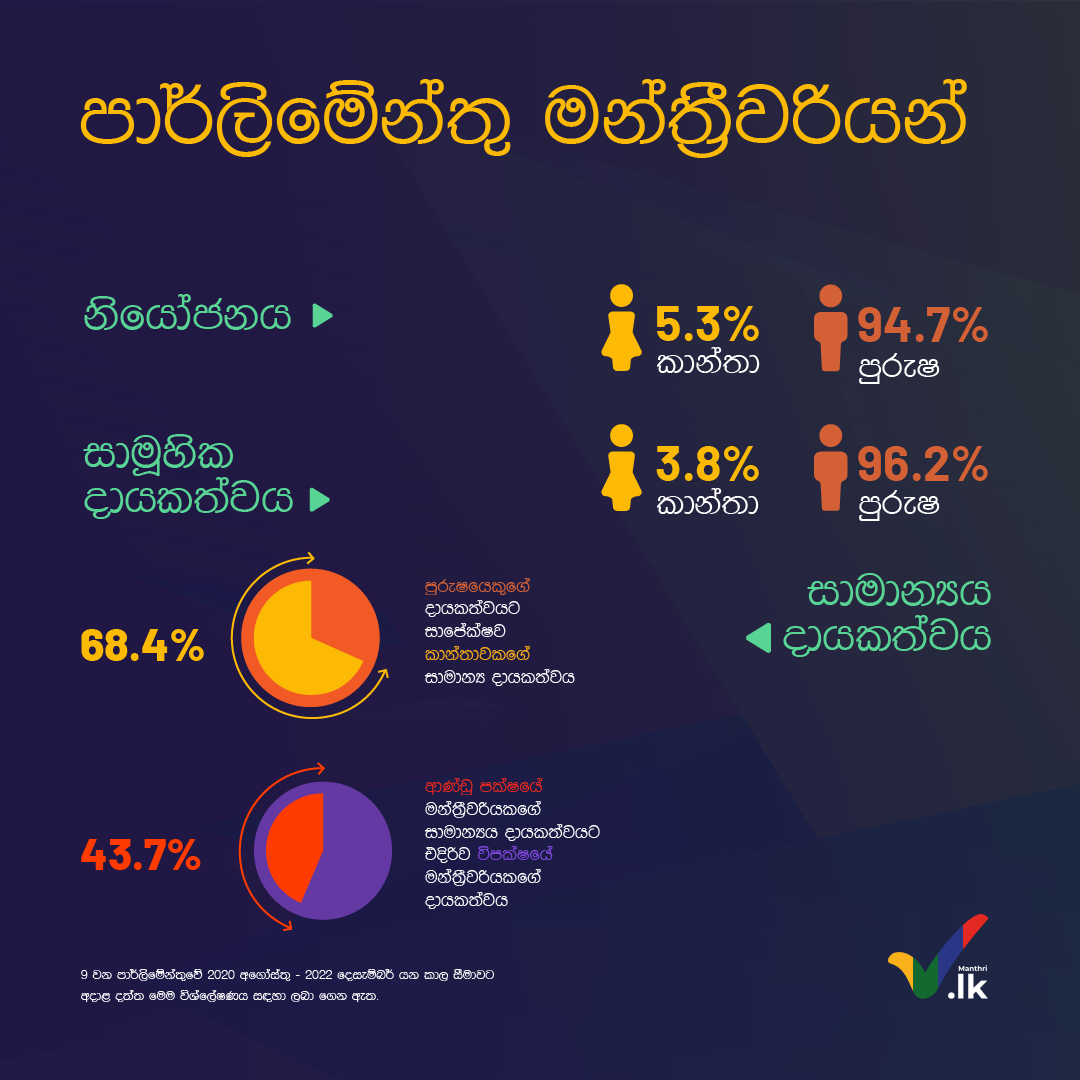
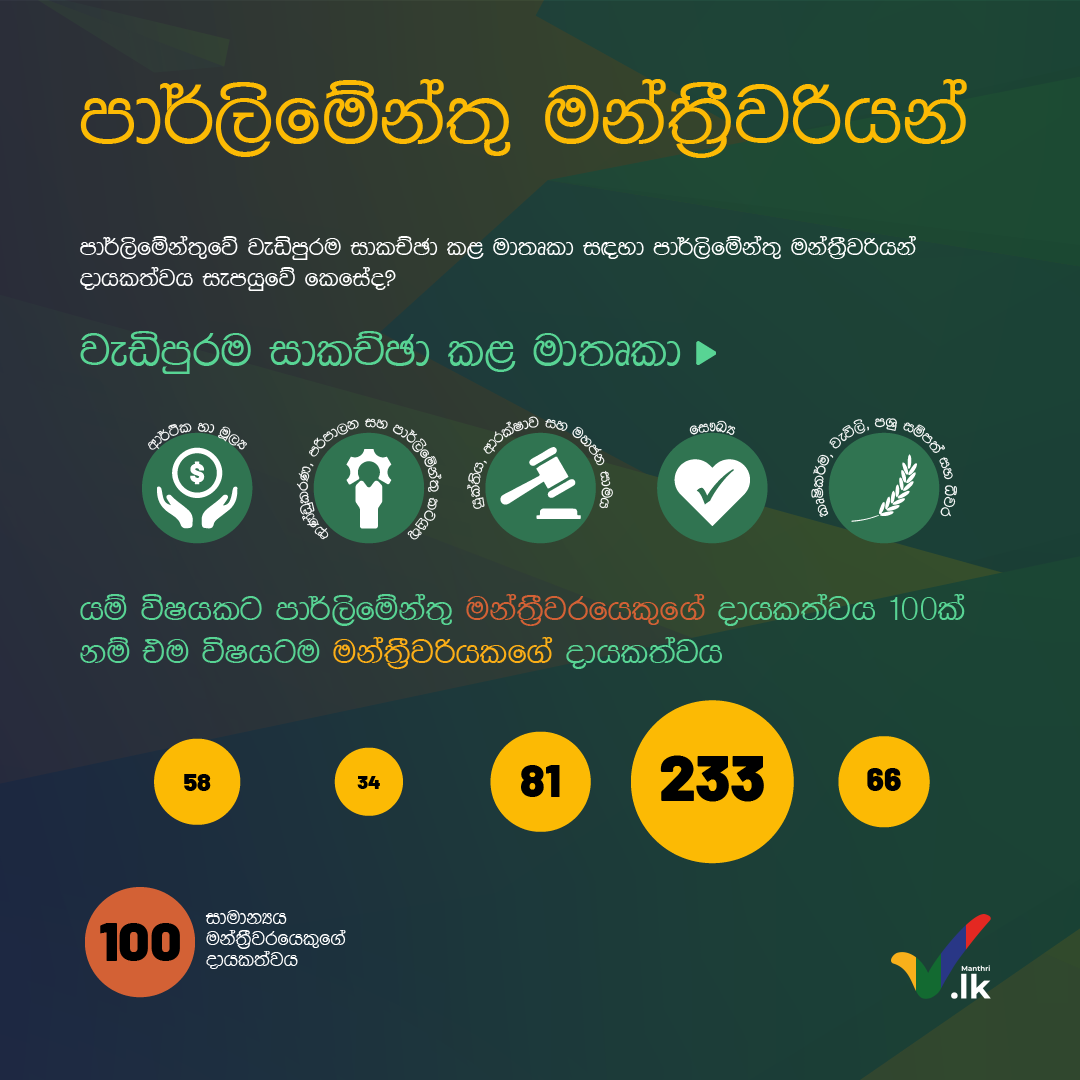
| dc.description | This infographic is available in English and Sinhala | en_US |
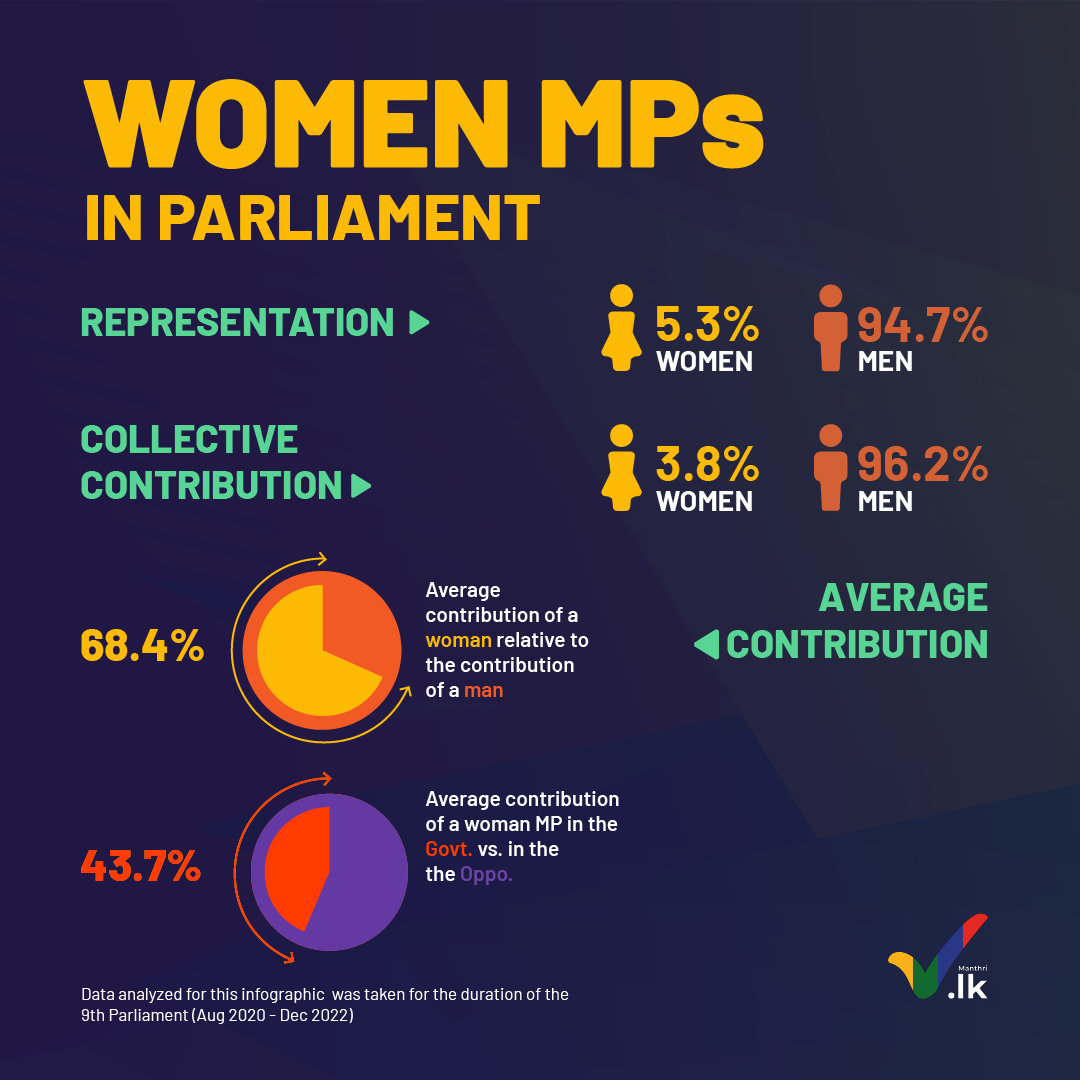
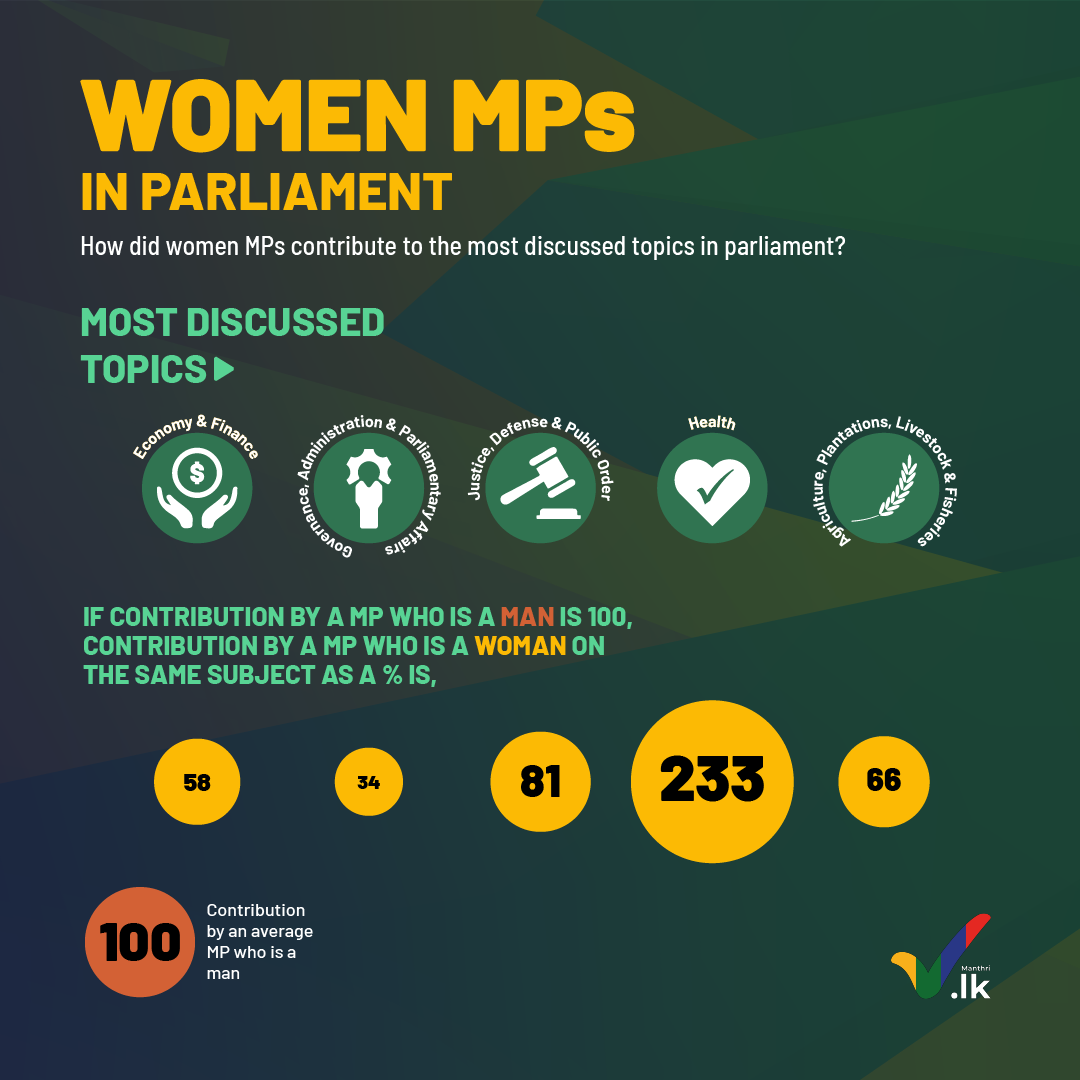
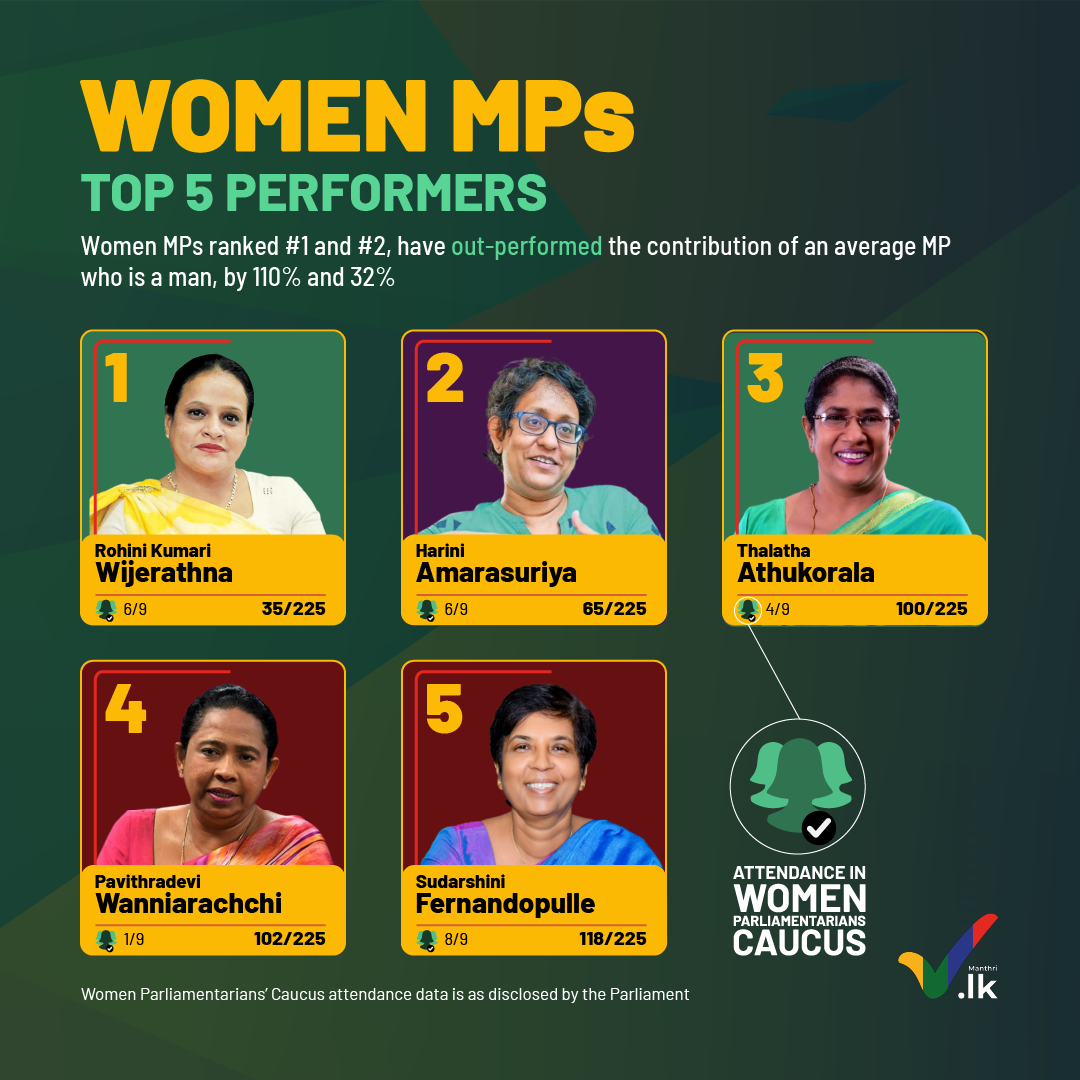
| dc.description.abstract | This infographic shows the women representation (F=5.3%; M= 94.7%) in 9th Parliament including collective contribution, average contribution of a woman relative to the contribution of a man, how the women MPs contributed to the most discussed topics in parliament and top 5 performers. | en_US |
| dc.language.iso | en | en_US |
| dc.publisher | Manthri.lk | en_US |
| dc.subject | 9th Parliament – Female legislators – Top performers | en_US |
| dc.subject | 9th Parliament – Women legislators – Top performers | en_US |
| dc.subject | 9th Parliament – Gender representation | en_US |
| dc.subject | 9th Parliament – Women representation | en_US |
| dc.subject | 9th Parliament – Women MPs – Productive contribution | en_US |
| dc.subject | Women MPs | en_US |
| dc.title | Women MPs in Parliament | en_US |
| dc.type | Infographics | en_US |
| dc.project.code | NED11 | en_US |