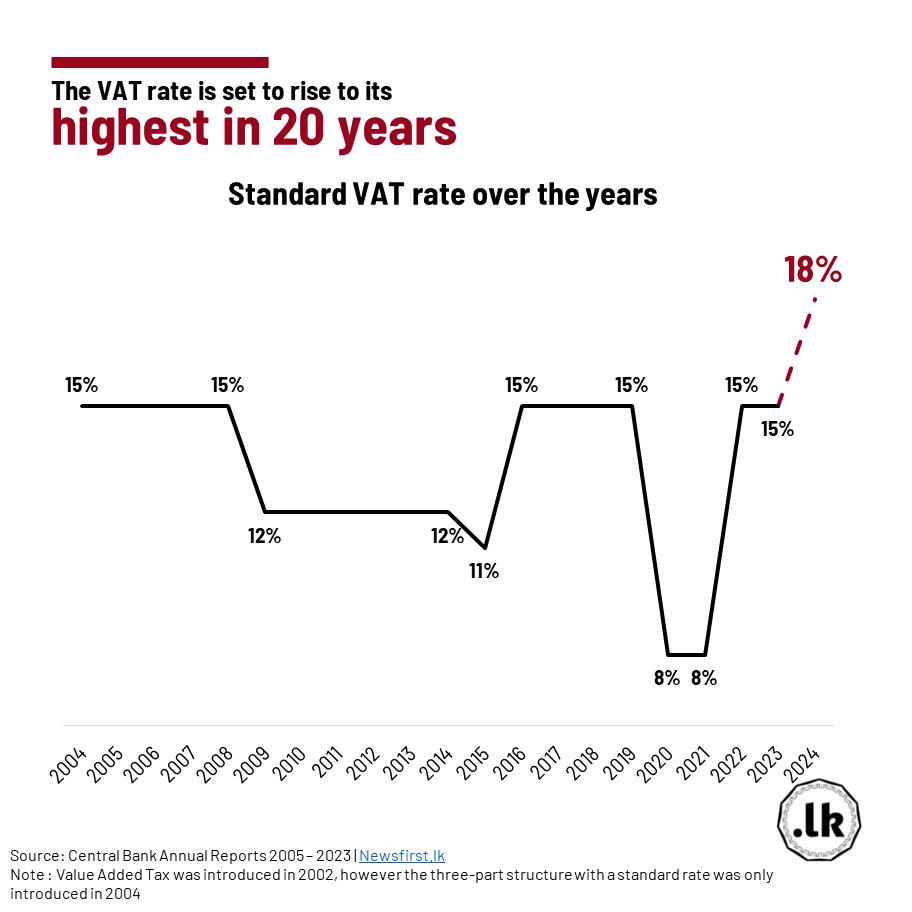
| dc.description.abstract | Initially introduced in 2002, the VAT comprised two tiers: a 10% rate applicable to certain goods and services, and a 20% rate for others. However, in 2004, these rates were unified to a 15% rate, which was officially adopted as the standard rate in 2005. Subsequently, the rate underwent several adjustments. It was reduced to 12% on January 1, 2009, and further decreased to 11% in 2015. Yet, it was raised again to 15% in 2016, before experiencing a significant decline to 8% in 2019 along with the various tax cuts announced in 2020. The VAT rate remained at 8% until 2021. In 2022, the rate underwent two changes: first to 12% in May, and then reverting to 15% in September. With the forthcoming amendment in 2024, the VAT rate is poised to reach a record high of 18%. | en_US |