| dc.contributor.author | Econ Team | |
| dc.date.accessioned | 2023-11-28T09:49:10Z | |
| dc.date.available | 2023-11-28T09:49:10Z | |
| dc.date.issued | 2021-11-02 | |
| dc.identifier.uri | https://archive.veriteresearch.org/handle/456/6202 | |
| dc.description | This entry contains 03 infographics available in English. They are also available on the Public Finance Platform. | en_US |
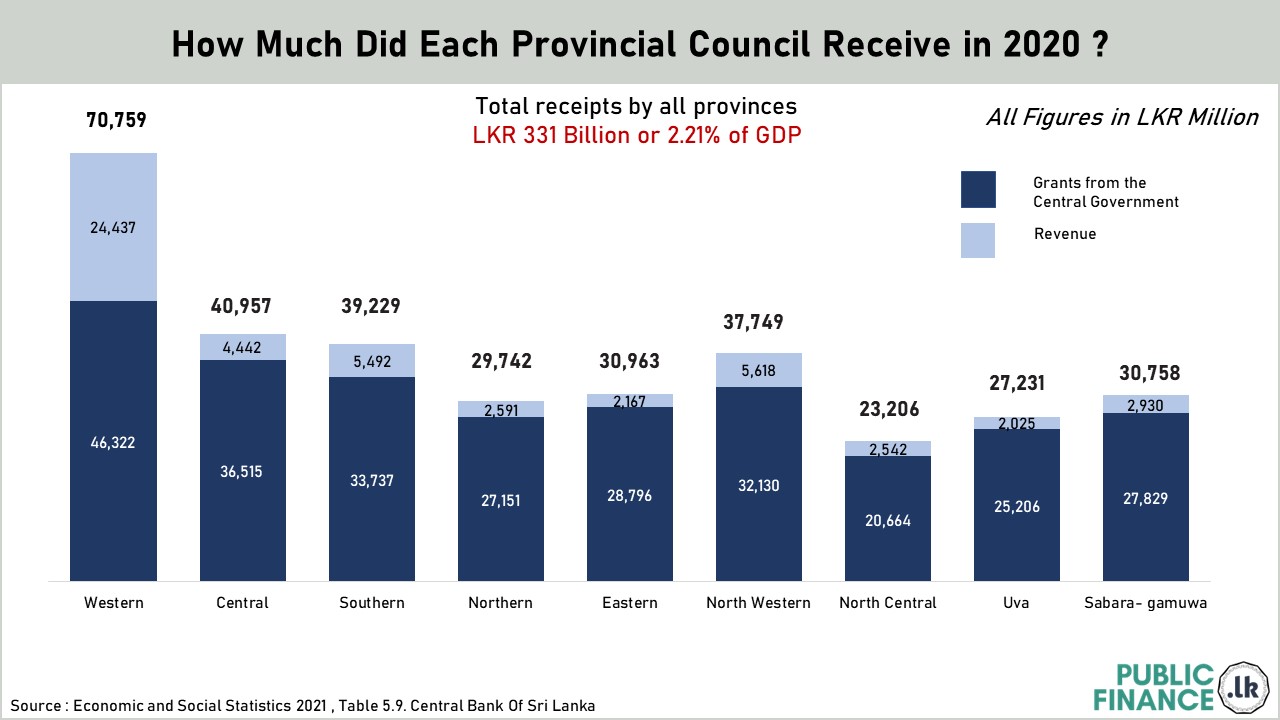
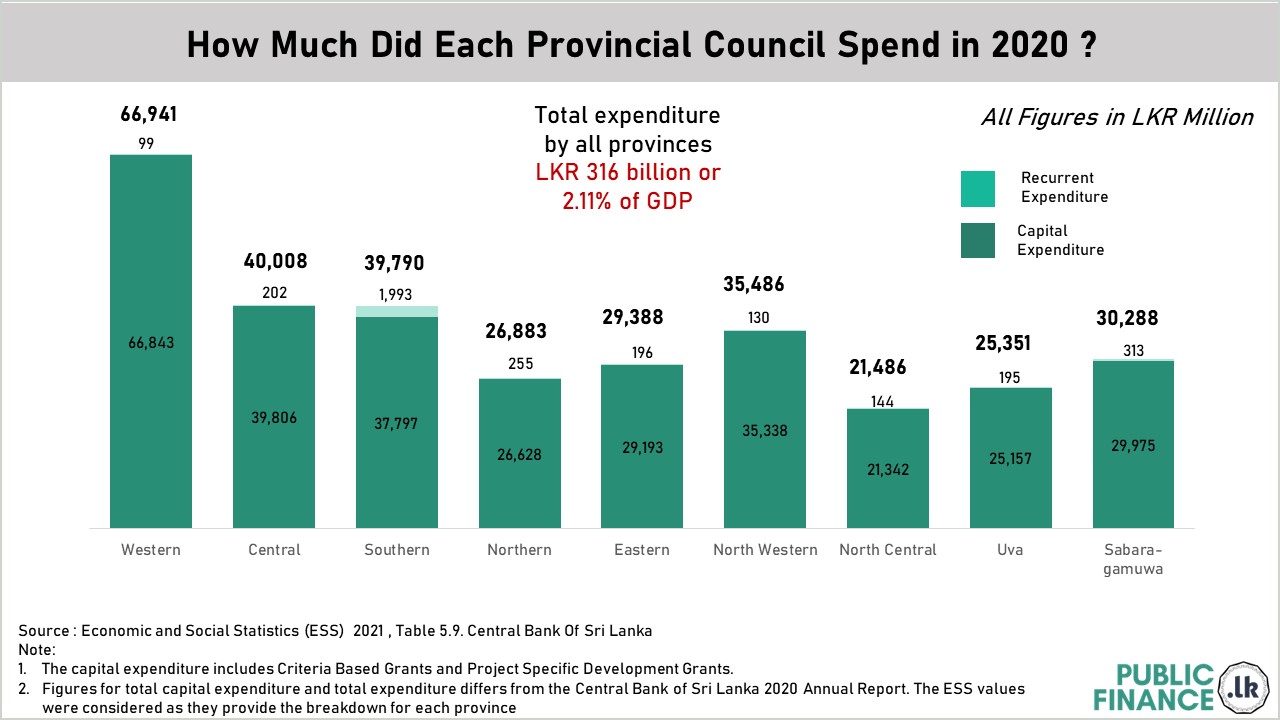
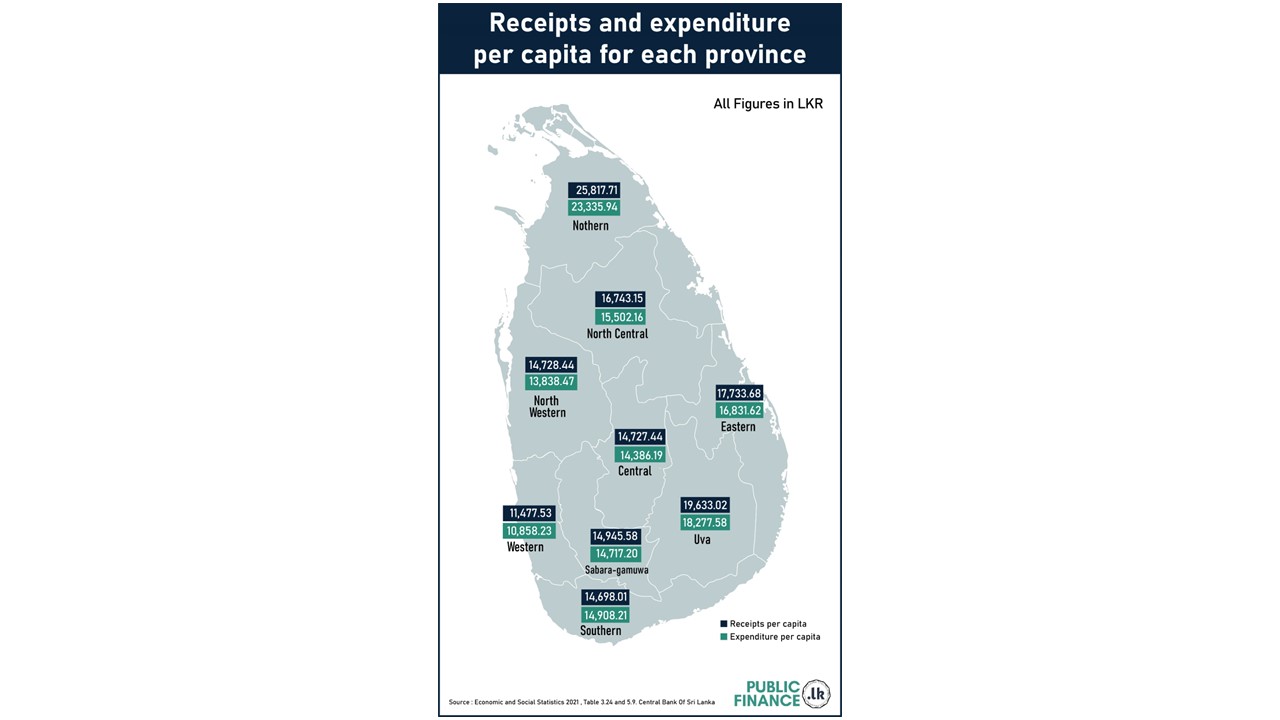
| dc.description.abstract | The finance commission makes an annual recommendation on the allocation of funds required to meet the needs of provincial councils to the government. The Western Province has the highest absolute value, and the North Central Province has the lowest absolute value for total receipts and expenditure. The Western Province accounts for 21% of total receipts collected by all provinces, also accounting for the highest revenue and grants in 2020. Revenue for Provincial Councils are generated from mainly two sources; i) Transfers of Government Revenue; ii) Revenue collection from Devolved Sources.The recommendation of grant allocations made to the provinces are based on mid-year population, provincial GDP, number of persons under poverty, median monthly per-capita income, persons per medical officer and number of university entrances in the science stream. The finance commission recommends the largest allocation of block grants to the Western Province due to the largest recurrent expenditure incurred. However, the actual grants received by the Western Province from 2017 to 2019 was the lowest. This pattern changed in 2020 where the Western Province received the highest absolute value of grants in 2020. Recurrent expenditure for all provinces significantly outweighs capital expenditure. Personal emoluments account for more than 70% of total recurrent expenditure. When considering the per capita terms of receipts and expenditure, the Western Province has the lowest per capita receipts of LKR 11,477 and per capita expenditure of LKR 10,588. This can be attributed to the densely populated nature of the province, even though it also has the highest per capita GDP among all provinces. | en_US |
| dc.language.iso | en | en_US |
| dc.relation.ispartofseries | Public Finance Infographics; | |
| dc.subject | Public finance - Provincial allocation | en_US |
| dc.subject | Public finance - Government revenue | en_US |
| dc.subject | Public finance - Financing | en_US |
| dc.subject | Public finance - Recurring expenditure | en_US |
| dc.subject | Public finance - Capital expenditure | en_US |
| dc.title | Provincial Council Receipts and Expenditure in 2020 | en_US |
| dc.type | Infographics | en_US |