• Login
    View Item 
    •   VR-IKR Home
    • Research Outputs
    • Econ
    • Infographics
    • View Item
    •   VR-IKR Home
    • Research Outputs
    • Econ
    • Infographics
    • View Item
    JavaScript is disabled for your browser. Some features of this site may not work without it.

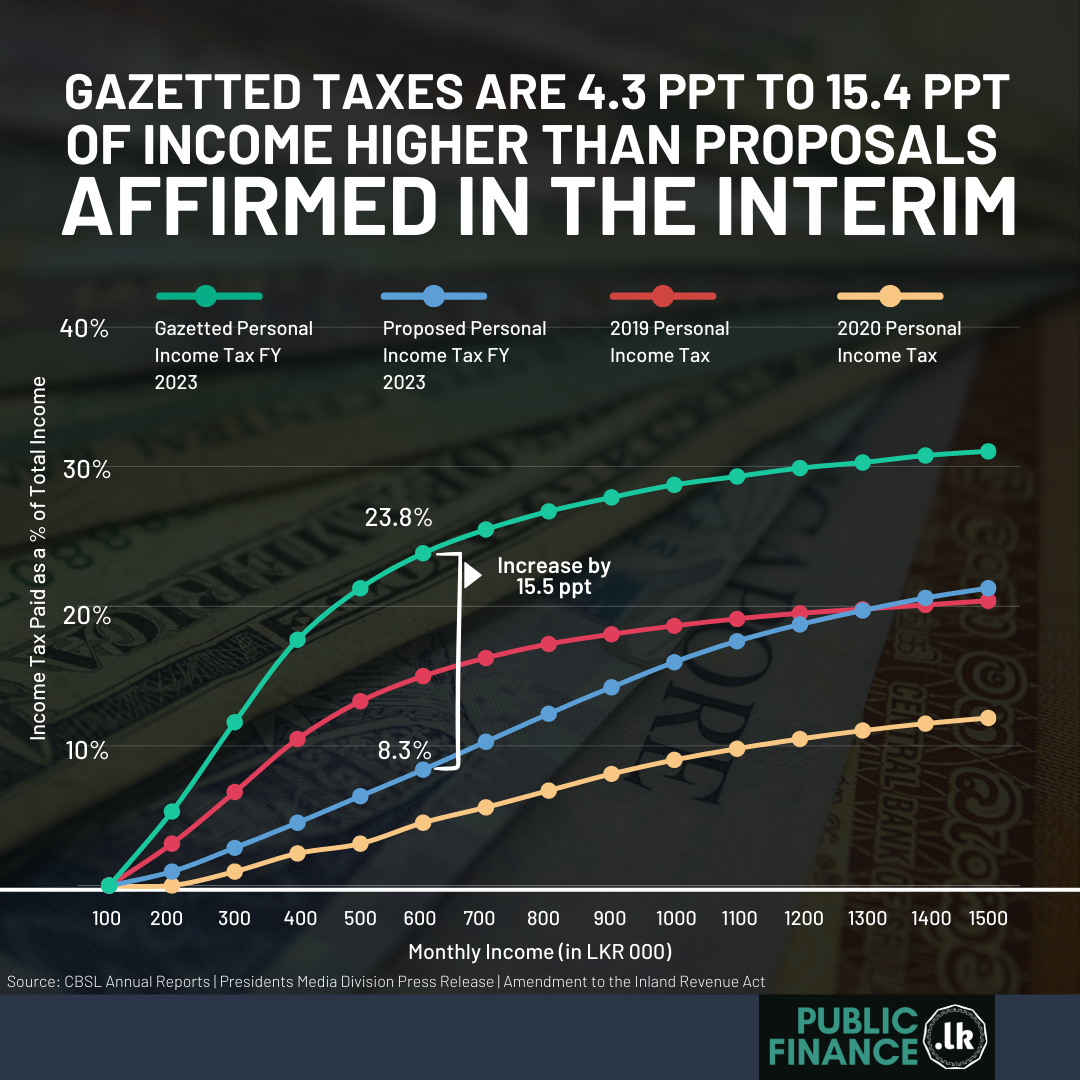
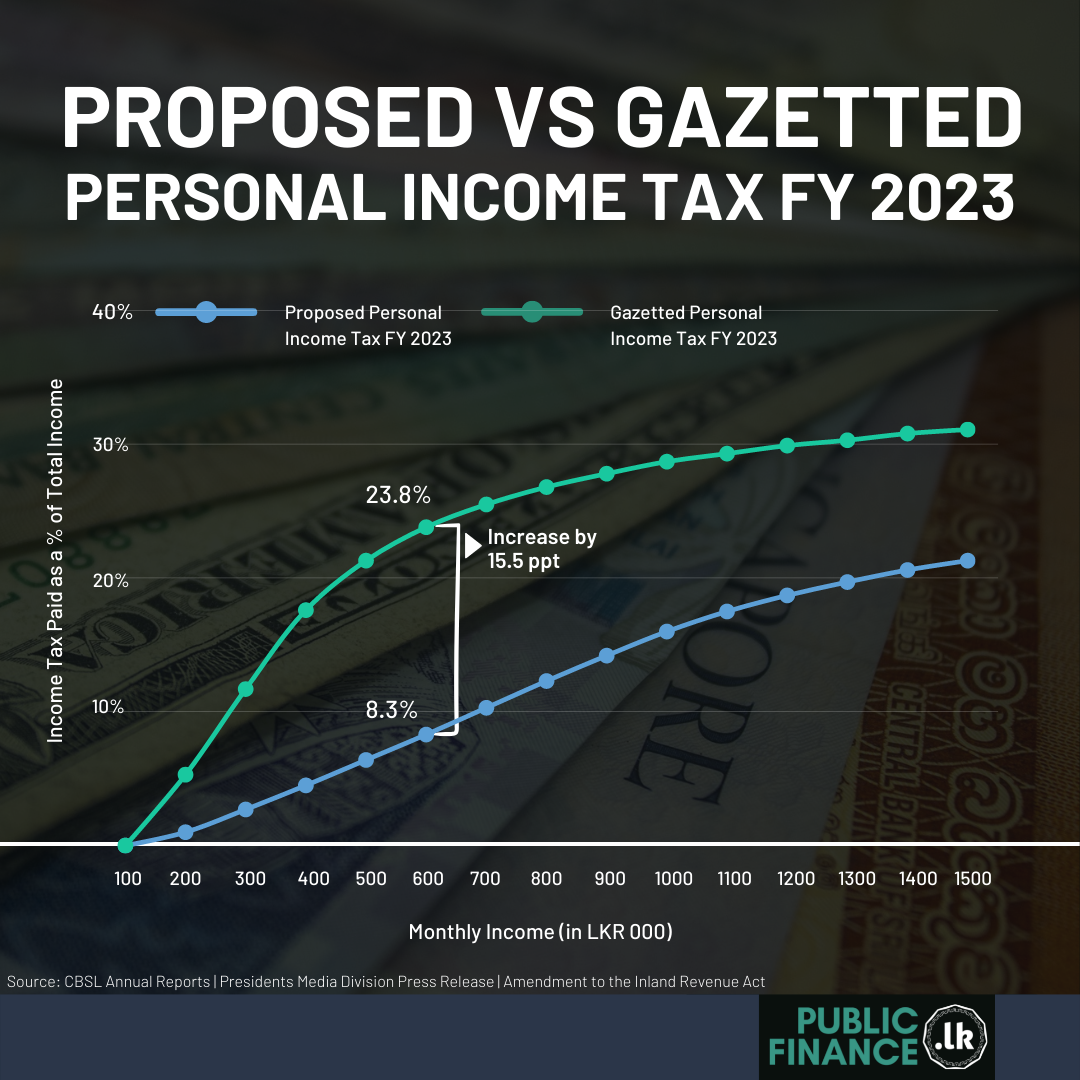
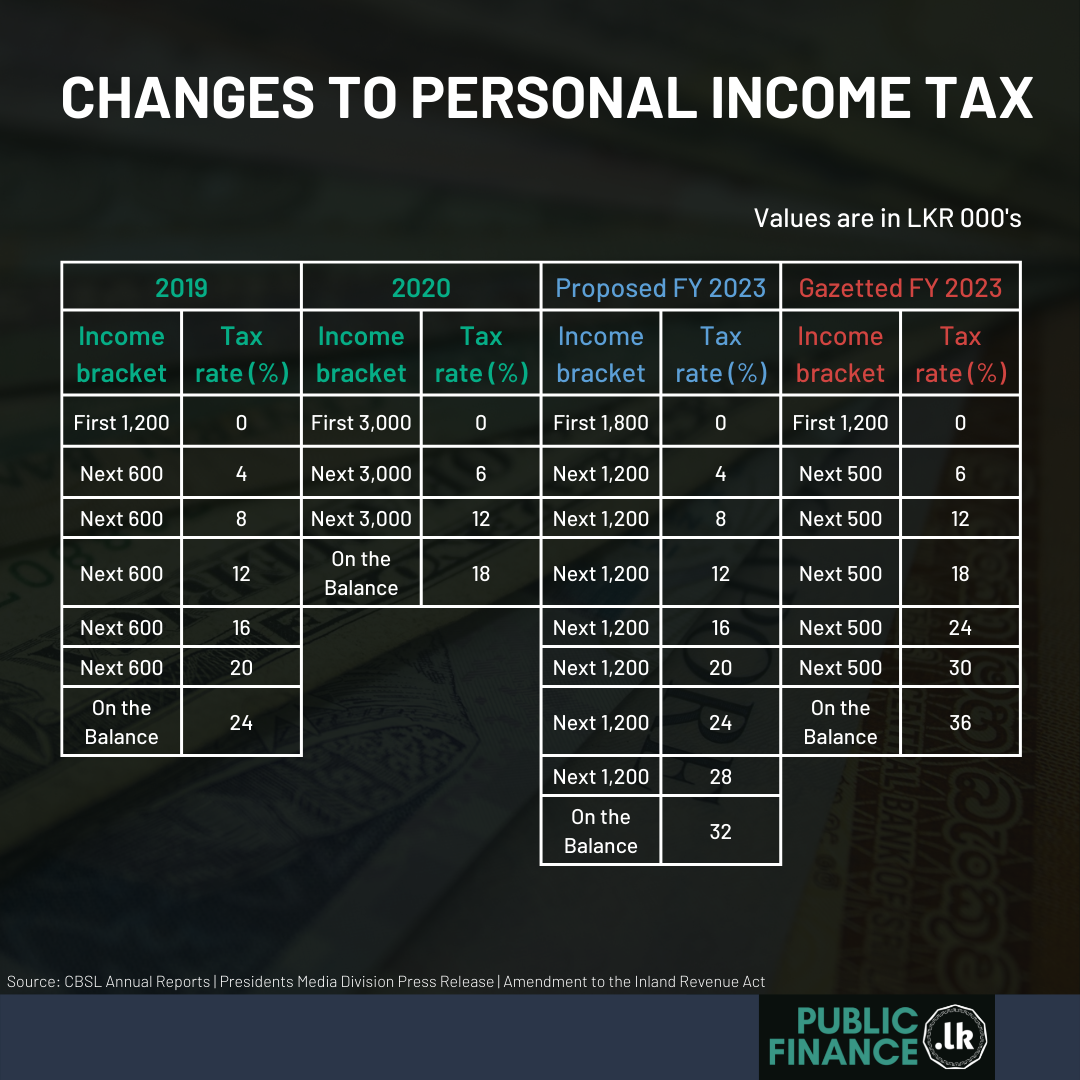
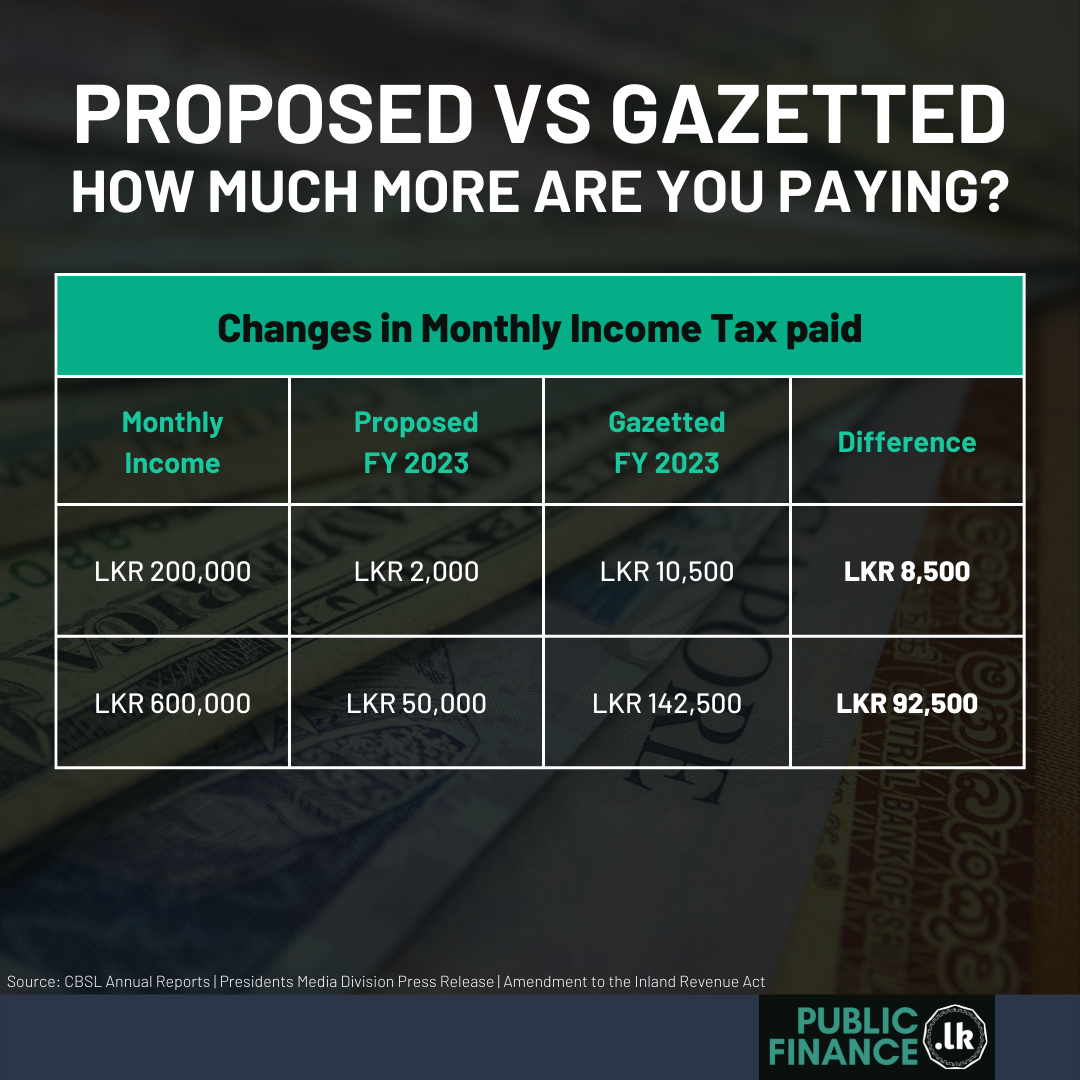
    Gazetted Taxes are 4.3ppt to 15.4ppt of Income Higher than Proposals Affirmed in the Interim Budget

    Thumbnail
    View/Open
    Cover Image (1.292Mb)
    English infographic 1 (998.4Kb)
    English infographic 2 (977.1Kb)
    English infographic 3 (828.3Kb)
    English infographic 4 (886.5Kb)
    Date
    2022-10-24
    Author
    Econ Team
    Series
    Public Finance Infographics;
    Metadata
    Show full item record
    Abstract
    The infographics provide details on how the recent personal income tax changes will affect the amount of personal income tax paid by an individual.
    Note
    Description
    The entry contains 5 infographics available in English and they are also available on the Public Finance Platform.
    URI
    https://archive.veriteresearch.org/handle/456/6160
    Collections
    • Infographics [181]

    • Verité Research Institutional Knowledge Repository copyright © 2018-2020  Verité Research
    • DSpace software copyright © 2002-2020  DuraSpace
    Contact Us | Send Feedback
    Theme by 
    Atmire NV


    Browse

    All of VR-IKRCommunities & CollectionsBy Issue DateAuthorsTitlesSubjectsThis CollectionBy Issue DateAuthorsTitlesSubjects

    My Account

    LoginRegister

    • Verité Research Institutional Knowledge Repository copyright © 2018-2020  Verité Research
    • DSpace software copyright © 2002-2020  DuraSpace
    Contact Us | Send Feedback
    Theme by 
    Atmire NV