| dc.contributor.author | Parliamentary Research Team | |
| dc.date.accessioned | 2022-02-10T13:52:39Z | |
| dc.date.available | 2022-02-10T13:52:39Z | |
| dc.date.issued | 2020-07-29 | |
| dc.identifier.uri | http://archive.veriteresearch.org/xmlui/handle/123456789/4335 | |
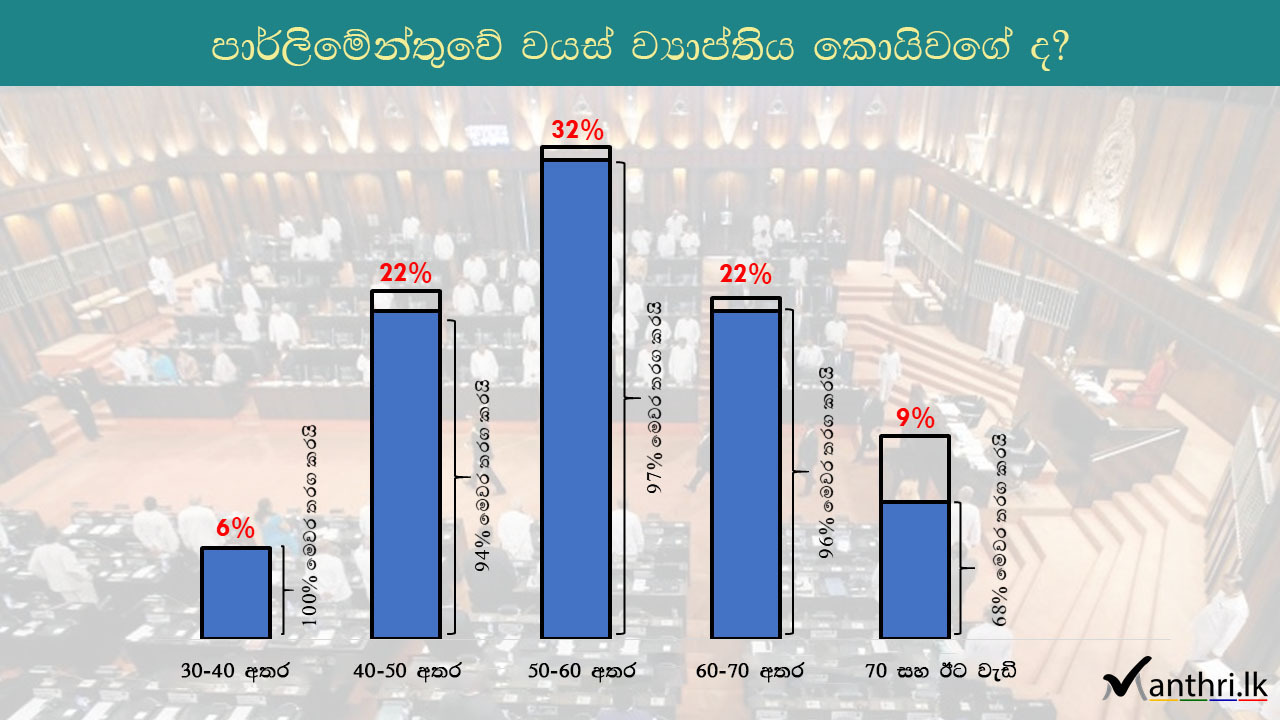
| dc.description | This Infographic is available in English and Sinhala. | en_US |
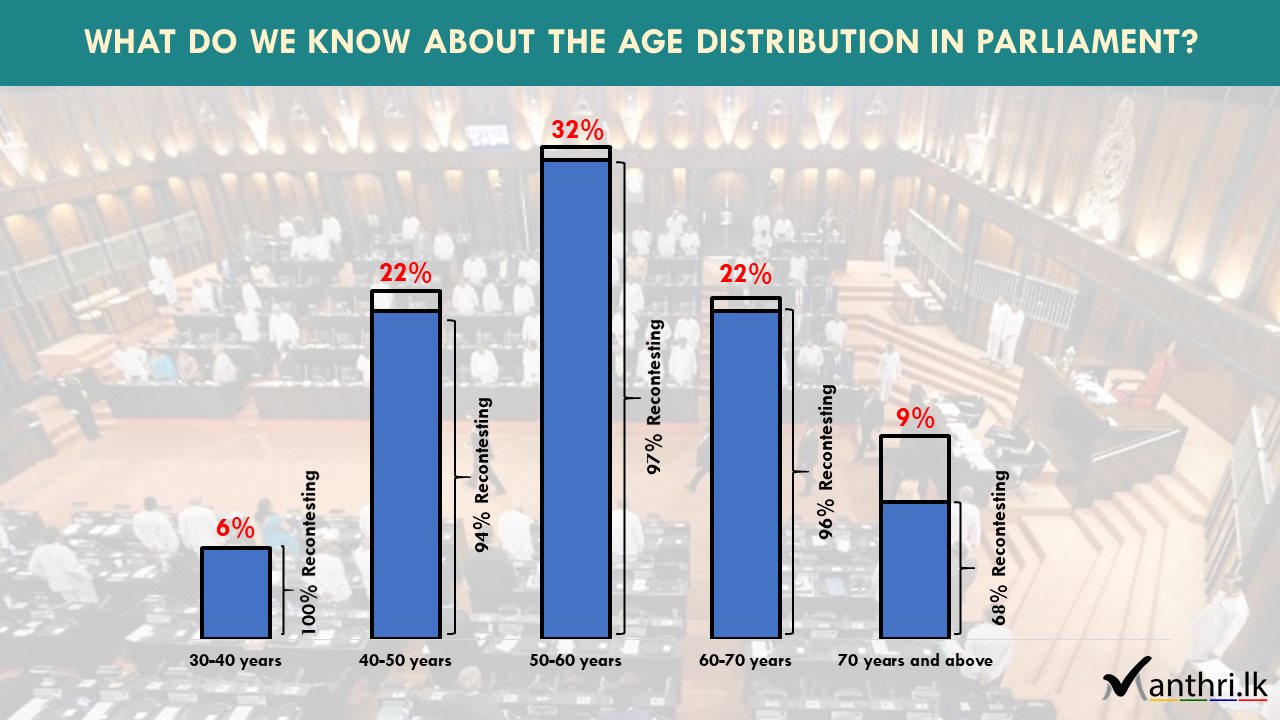
| dc.description.abstract | This Infographic shows the age distribution in the 8th Parliament. Most MPs from the previous parliament were from the '50-60 years' age category. | en_US |
| dc.language.iso | en | en_US |
| dc.publisher | Manthri.lk | en_US |
| dc.subject | 8th Parliament - Age Distribution - 30 to 40 Years | en_US |
| dc.subject | 8th Parliament - Age Distribution - 40 to 50 Years | en_US |
| dc.subject | 8th Parliament - Age Distribution - 50 to 60 Years | en_US |
| dc.subject | 8th Parliament - Age Distribution - 60 to 70 Years | en_US |
| dc.subject | 8th Parliament - Age Distribution - 70 Years and above | en_US |
| dc.title | What do we know about the Age Distribution in Parliament? | en_US |
| dc.type | Inforgraphics | en_US |
| dc.project.code | NED08 | en_US |